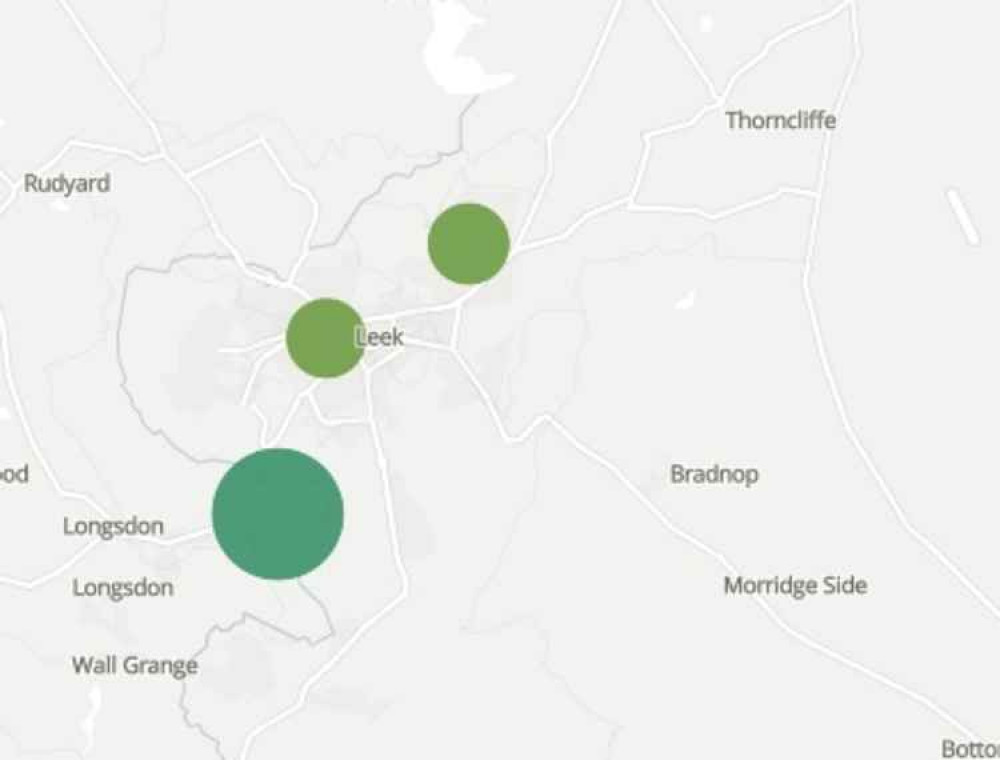
Interactive map: Coronavirus deaths plummet in Leek as vaccine takes effect
By Jack Lenton 29th Apr 2021


Coronavirus deaths have plummeted to almost zero in every area of Leek as the effect of the vaccine has been shown in the latest statistics.
In Leek and the rest of the country, almost every adult over 50 has now been vaccinated - with this group also accounting for the vast majority of Coronavirus deaths.
And this effect can be clearly seen in the latest update from the Office for National Statistics (ONS).
Their latest figures - published late last week - show that there have been only three Coronavirus deaths in every area of Leek combined throughout March.
That is a huge drop compared to January, when the town saw 24 Coronavirus deaths occurring throughout the month.
The ONS interactive map is updated every month to show a localised version of every death where Covid-19 was the underlying (main) cause on the death certificate.
The data breaks down the number of deaths in each area of Leek, and also shows the month that each death occurred in this time.
Any months that are not included from March 2020 to March 2021 means that there were no deaths in that month.
Leek East and Upper Hulme April 2020 - 2 deaths May 2020 - 2 deaths July 2020 - 2 deaths October 2020 - 2 deaths November 2020 - 2 deaths December 2020 - 3 deaths January 2021 - 5 deaths February 2021 - 3 deaths March 2021 - 1 deathLeek Town
April 2020 - 4 deaths
May 2020 - 1 death
July 2020 - 1 death
November 2020 - 3 deaths
December 2020 - 4 deaths
January 2021 - 3 deaths
February 2021 - 5 deaths
Leek South and Cheddleton March 2020 - 1 death April 2020 - 9 deaths May 2020 - 2 deaths June 2020 - 1 death November 2020 - 2 deaths December 2020 - 18 deaths January 2021 - 16 deaths February 2021 - 5 deaths March 2021 - 2 deathsLet's hope that this downward trend continues when the latest figures for April are released next month.
If you would like to view the interactive map in full, click here.
CHECK OUT OUR Jobs Section HERE!
leek vacancies updated hourly!
Click here to see more: leek jobs
Share:

