How many Covid cases in each area of Leek? - Latest local stats
By Jack Lenton 31st Dec 2021


How many current Covid cases are there in each area of Leek?
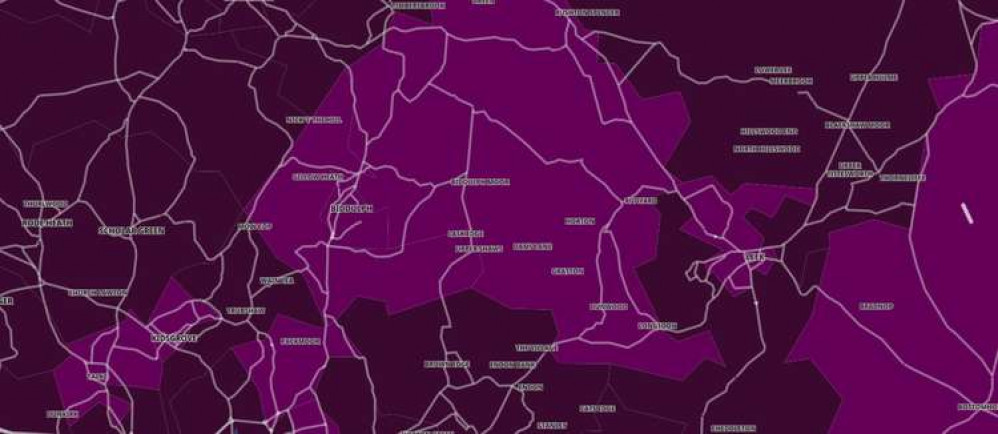
An interactive map on the Government website gives updated daily local stats on the current situation regarding Covid cases.
It displays exactly how many cases there are in each area of the town as well as case rates.
So what is the latest situation in Leek when it comes to Covid cases? We took a look at the stats to find out.
The latest available stats are for the seven days to 24 December 2021. See them below:
Leek Town: 65 cases - a case rate of 779.7 per 100,000 people Leek South & Cheddleton: 89 cases - a case rate of 808.2 per 100,000 people Leek East & Upper Hulme: 65 cases - a case rate of 852.8 per 100,000 peopleAs you can see from the stats, Leek South and Cheddleton is currently suffering from the most Covid cases - but Leek East and Upper Hulme has the highest case rate.
Leek Town is doing the best when it comes to low Covid cases and case rates.
The latest daily cases for Staffordshire as a whole is 1,207.
It is important to note that while it may appear that Leek has a lot of cases, it is performing significantly better than average for the West Midlands and England.
The Covid case rate for the West Midlands is 989.6, and England's rate is even worse at 1,251.4.
Don't forget to sign up to our newsletter below to get the top 10 Leek stories of the week delivered straight to your inbox every Friday! No click-bait. No intrusive ads. Just news about Leek.
CHECK OUT OUR Jobs Section HERE!
leek vacancies updated hourly!
Click here to see more: leek jobs
Share:

